Following on from last week’s analysis of English Premier League Football, I decided to take a look at the competitiveness of the three main Rugby Union leagues in Europe – the Aviva Premiership, the Magners League, and the French Top 14. As with the football analysis, I’ve created a competitiveness index* building on analysis first carried out by footballeconomics.com. This uses a statistical technique to allow us to analyse the variation in each league. A perfectly competitive league would produce a competitive value of 1 in this index, as all teams would end up winning an equal proportion of the points on offer.
For this analysis, I’ve looked at the last 5 years for each competition, and have plotted all three competitions on the chart below.
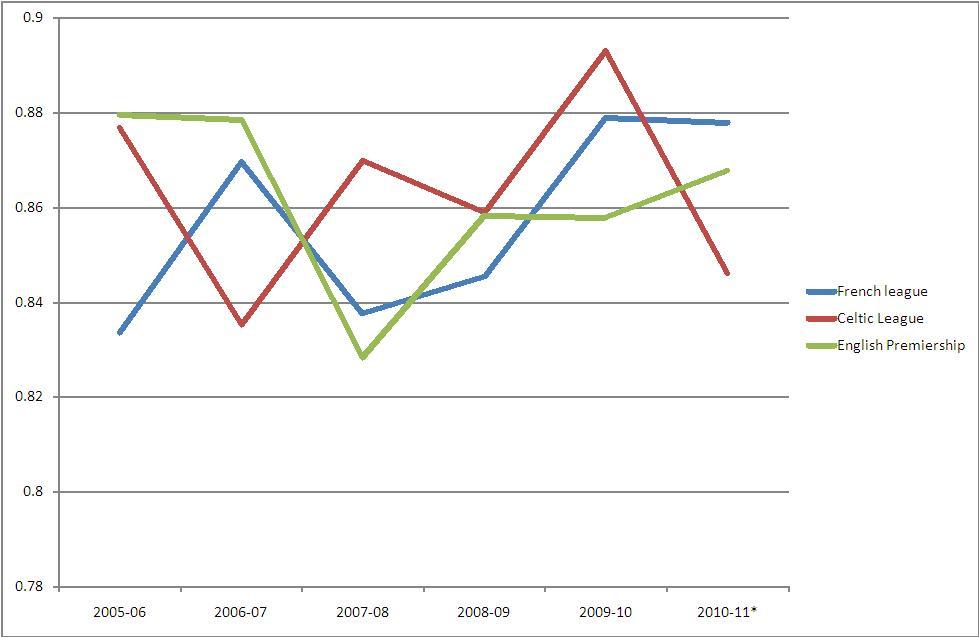
From the above, it is very difficult to identify any clear trends. It suggests that all three leagues are roughly as competitive as each other, with all having variations in competitiveness over the last five years. In 06-07 the English Premiership was the most competitive, in 07-08 the Celtic League and this year it appears that the French league is the most competitive. All three leagues have been the least competitive relative to each other at some point in the last five years too.
Of course, this says nothing of the overall quality of play in each of the three leagues, but if you’re looking for competitive rugby it would appear that there is little to choose between the three major professional leagues in Europe.
(* in which the competitiveness value is equal to one minus the standard deviation of the proportion of points achieved by each team)
(* in which the competitiveness value is equal to one minus the standard deviation of the proportion of points achieved by each team)
Can you explain how you came to these numbers? It just looks like you made it up.
ReplyDeleteAnonymous - Sorry, this followed on from last week's piece, but being in a different month I guess it doesn't appear on the same page. Thanks for bringing it to my attention. I've now updated the post to make it a little clearer.
ReplyDeleteThe figures are equal to one minus the standard deviation of the proportion of points gained by each team in each league. A perfectly competitive league would see all teams gain the same proportion of the points on offer. This would produce a figure of 1 (as the standard deviation itself would be zero).
This was the approach taken by footballeconomics.com in their 2006 analysis of the competitiveness of the English Premier League (soccer), some of which I updated for my previous blog entry.
Are you sure that works for rugby? The point scoring system is different, as not only wins, draws and losses are rewarded, but there is also a bonus system for getting an arbitrary number of tries or a defeat by less than a different arbitrary number. So the total number of league points gained can differ from game to game.
ReplyDeleteIn addition, I believe that France uses a different try bonus system from the other leagues, so you're not really comparing apples with apples.
Hi Nick,
ReplyDeleteThanks for your comments.
It works because we are looking at the proportion of the maximum available points gained, rather than the actual number of points. This also allows you to compare across a number of years when the scoring system changes (e.g. when you only got 2 points for a win in football, which is covered in the footballeconomics.com article I referred to in a previous post)
Similarly, the fact that France uses a different system to the other two doesn't really matter as we are looking at the variation in the proportion of points gained in each league separately. It would be interesting if the different points system meant that the French league was particularly competitive/uncompetitive when compared to the others but that doesn't seem to be the case.